|
|
 |
|
|
|
 |
 |
|
|
 |
Models give a stormy outlook for the future
Global warming will have an impact
|
|
Cycles in hurricane activity
Climate research over recent decades has led to observations of changes in the conditions which are responsible for hurricane formation. The observed patterns indicate that ocean currents, sea surface temperature and the global weather system oscillate in periods of about 25 years.
|
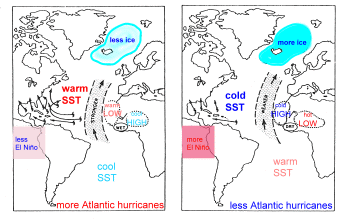
During the years 1945 - 1970 heat transport from the South Atlantic Ocean to the North Atlantic Ocean was relatively strong. At the same time, there was less sea ice around the North Pole and above average rainfall took place in the Sahel region in Africa. The Gulf of Mexico was warmer than average and the hurricane intensity high, while it was below average in Asia. El Niño events seldom occured. Comparable conditions are now emerging again, while the period 1970 - 1995 was clearly less dominated by storms in the Atlantic Ocean.
|
 |
 |
 |
|
1. Factors which are related to high (on the left) and low (on the right) probabilities of hurricanes in the Gulf of Mexico.
Graph according to Gray and Sheaffer (1991), SST = sea surface temperature.
Please click the image to make it larger. (30 KB)
|
|
|
Models for the future
Besides natural changes, it is of particular interest to see if human acivity has an influence on the frequency of hurricanes. This can only be estimated using climate models and hurricane models.
Climate models tell us, for example, how much temperatures in the air and on the sea surface will change due to the changes in the greenhouse gas concentration. Hurricane models can simulate how the hurricane intensity and frequency will adapt to different climate conditions.
|

Emissions lead to higher CO2 values
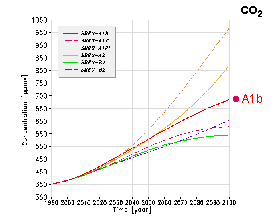
Speaking about model calculations we have always to consider, that the results depend much on the input data. The results will certainly be different if we assume a world in which the combustion of oil, coal and natural gas is immediately and drastically reduced or if we assume a world in which fossil fuels are completely used up.
|
 |
 |
 |
|
2. Assumptions for the development of the CO2 ratio according to different economic and political conditions.
Graph: IPCC (Please click the image.)
|
|

More greenhouse gases cause global warming
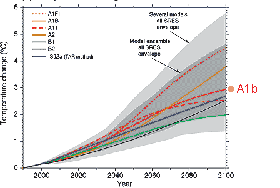
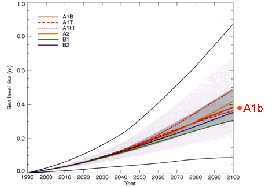
The graphs show how the average temperature on the Earth will increase as a consequence of different changes in the CO2-concentration and how the sea level may rise. With increasing air temperatures the temperatures in the oceans will also increase.
|
 |
 |
 |
|
3. Possible increase in air temperature following different scenarios of greenhouse gas emissions.
Graph: IPCC (Please click the image.)
|
|

Due to higher air temperatures the sea becomes warmer and the sea level rises.
Thomas R. Knutson and Robert E. Tuleya used numerous model scenarios for an 80 years simulation to the future. It was assumed that the CO2 ratio in the air increases by 1% per year and that it doubles after 70 years. According to the models the sea surface temperature would increase by 0.8 - 2.4°C.
|
 |
 |
 |
|
4. Different assumptions for a sea level rise in warmer oceans.
Graph: IPCC (Please click the image.)
|
|

Warmer oceans foster stronger hurricanes
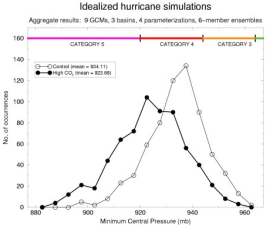
The graph on the right shows the consequences for hurricane probability and strength if the average of all climate model outcomes is considered. We see that for this realistic scenario the number of hurricanes does not increase but they clearly become stronger and the highest category number 5 will be reached much more often.
|
 |
 |
 |
|
5. Increasing hurricane probability (from left to right) in a warmer world (filled circles) compared to a world without CO2 increase (open circles).
Model according to: Knutson & Tuleya, J. Clim., 17, 3477 (2004) (Please click the image.)
|
|

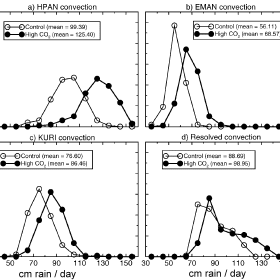
Warmer air can take up more water. This goes down in stronger rainfall during the hurricane.
The rainfall during a hurricane increases by 13 - 26% compared to the scenario without carbon dioxide increase.
|
 |
 |
 |
|
6. Increase in daily rainfall according to different models in the study of Knutson (see above).
|
|
|
Can we already estimate trends?
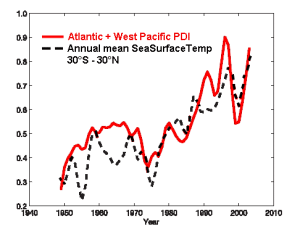
Kerry Emanuel (Nature, Vol. 436/4, Aug. 2005) introduces in a very new study the Power Dissipation Index (PDI), which refers to the duration and intensity of a storm. It gives clearer information about the real destructive forces of tropical cyclones than their frequency or economic losses can give.
|
 |
 |
|
7. Temporal development of a power dissipation index for tropical cyclones compared to the sea surface temperature of the oceans.
According to K. Emanuel (Nature, 2005). Please click the image.
|
|
 |
Emanuel summarised and averaged this index over the storms occuring in recent years and the storm regions in the world. The result shows a parallel development of the PDI and the average annual sea surface temperature in the storm belt between 30°N and 30°S. Both curves show a clear increase during the last 30 years.
Since the increase in water temperature can be primarily assigned to human influences, we could argue that also the increase in the destructive forces of the storms might already be influenced by human climate impacts. The storms are more intense and last longer.
|
|
However, the parallelism in water temperatures in this model is not perfect and the scientific approach is very new and just opened for discussion in the scientific community. We are sure that at present and in the future the other factors play a role as well: the multidecadal oscillation, the occurence and strength of El Niño events and changes in the wind shear.
|
|
 |
|


