|
|
 |
|
|
|
|
| |
|
|
|
Lower Atmosphere
Read more |
Measurement techniques - spectroscopy
Most of the trace gases in the atmosphere exist in concentrations of less than one millionth. How can we know about the exact concentration? Which measurement techniques are usually used?
|
|
|
|
|
|
|
For the analysis of air, either in the laboratory or directly outside, two techniques are used very often:
a) spectroscopy - resting upon the different interactions of molecules with light
b) chromatography - resting upon the different interaction of molecules with other molecules
|
 |
|
|
1. The electromagnetic spectrum consist of different sorts of electromagnetic waves with different energies. Most of them are useful to investigate the atmosphere, the character and the concentration of molecules in the air.
source and further inforamtion about the electromagnetic spectrum:  NASA NASA
|
|
|
The character of radiation
From our daily life experience with radios, microwaves, tanning salons and X-ray examinations we know, that there are a lot of electromagnetic waves in the air, all with different energy and only some of them visible as light. All the waves together form the electromagnetic spectrum. The energy of such waves increases in the order radio waves, microwaves, infrared light, visible light, UV light, X-rays. The shorter the wavelength, the higher the frequency, the higher the energy. Nearly all of these waves interact with molecules in the air and from the way they do we can see what molecule caused this interaction.
|
|
Wavelength, frequency and energy of the different regions of the electromagnetic spectrum:
|
|
Wavelength (m) |
Frequency (Hz = s-1) |
Energy (J) |
|
Radio |
> 1 x 10⁻¹ |
< 3 x 10⁹ |
< 2 x 10-24 |
|
Microwave |
1 x 10⁻³ - 1 x 10⁻¹ |
3 x 10⁹ - 3 x 10¹¹ |
2 x 10-24- 2 x 10-22 |
|
Infrared |
7 x 10⁻⁷ - 1 x 10⁻³ |
3 x 10¹¹ - 4 x 10¹⁴ |
2 x 10-22 - 3 x 10-19 |
|
Optical |
4 x 10⁻⁷ - 7 x 10⁻⁷ |
4 x 10¹⁴ - 7.5 x 10¹⁴ |
3 x 10-19 - 5 x 10-19 |
|
UV |
1 x 10⁻⁸ - 4 x 10⁻⁷ |
7.5 x 10¹⁴ - 3 x 10¹⁶ |
5 x 10-19 - 2 x 10-17 |
|
X-ray |
1 x 10-11 - 1 x 10⁻⁸ |
3 x 10¹⁶ - 3 x 10¹⁹ |
2 x 10-17 - 2 x 10-14 |
|
Gamma-ray |
< 1 x 10-11 |
> 3 x 10¹⁹ |
> 2 x 10-14 |
|
Interaction of light and molecules
If a wave meets a molecule in the air, it may transfer its energy to the molecule and change the state of the molecule. To make a molecule rotate needs less energy than to make the bondings swing and even more energy is needed to transfer electrons to another orbit around the atomic nuclei. All this depends on the atoms of the molecule, its size and the strength of the bonds. Certain molecules consume certain fractions of the electromagnetic spectrum for certain changes in their states. Therefore, if we send radiation through the air and compare the radiation before and behind the air parcel, we see that certain fractions of the radiation have been absorbed (consumed) by the molecules, and from the character of the absorption we can conclude on the character and the concentration of the molecules.
|
|
|
|
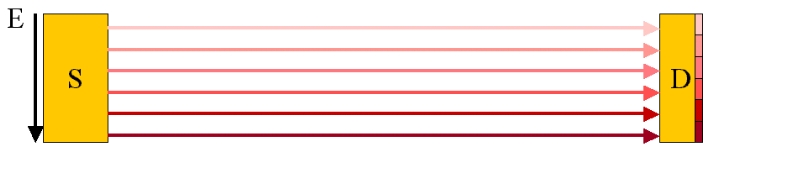
Let's assume we emit from a source of infrared light (S) of different energy (E) a beam through an air parcel and measure which fraction of the light reaches a detector (D). The different energies (= different wavelengths) are shown in different reddish colours.
|
|
|
|
A certain molecule absorbs light of certain energy (two of the six different energies are blocked) and this light does not reach the detector anymore. If we subtract the original spectrum without the molecule from the one with the molecule, an absorption peak appears, which is shown on the right. This peak stands for the lost light and the more light is absorbed, the higher this peak becomes (see figure 2d).
|
 |
|
|
2. a-c) Animations by Elmar Uherek
Please click to enlarge! (30 K)
|
|
|
Another molecule absorbs light, too. But more energy is needed to make the bonds swing. The absorption peak appears at another energy (wavelength) of the spectrum.
|
 |
|
|
2. d) In contrast to the three images before, we zoom in now in a small energy range (all arrows have the same colour = nearly same energy), e.g. the absorption energy from the first molecule. The weakening of the colours at the detectors tells us, the light arriving at the detector becomes less, the more molecules we have. The height of the absorption band (it is a negative band, telling us, that LESS light reaches the detector) grows.
|
|
|
From the spectrum we get not only the information which molecules are in the air (position of the absorption band). From the intensity of the absorption band, we also get the information how many molecules are in the air, because the retention of light is proportional to the number of molecules.
|
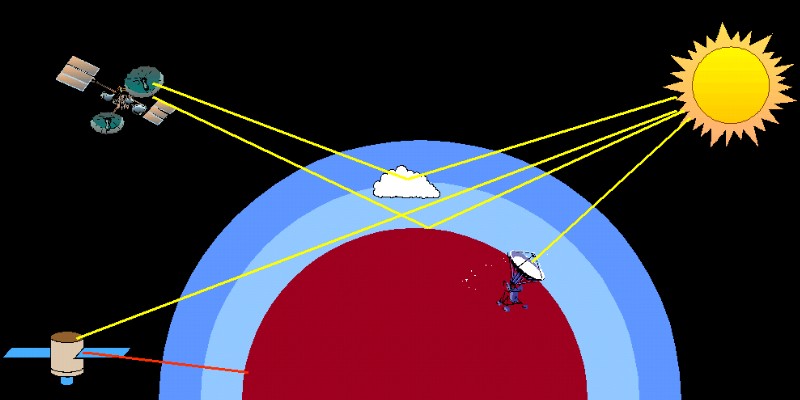
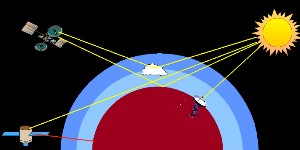
In the atmosphere there are several possibilities to measure the absorption of light. On the Earth the absorption of light from the sun or the moon can be measured (UV-VIS range). Satellites measure infrared light emitted from the Earth. They can also measure sunlight, which is reflected by the Earth or on clouds or which runs tangential to the Earth's surface.
|
|
 |
|
|
3. Satellite based measurements of absorption in the atmosphere
image by Elmar Uherek
|
|
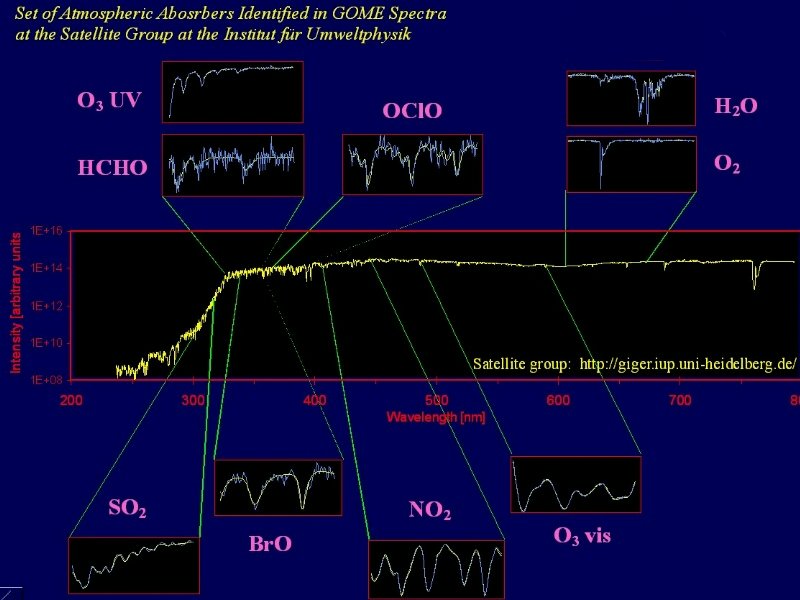
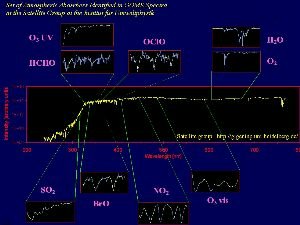
Nowadays the infrared heat radiation of the Earth (surface temperature) is measured by satellites. But also many important inorganic compounds like ozone, nitrogen oxides or halogen oxides can be observed from the space. One example for such measurements is the Global Ozone Monotoring Experiment (GOME). Not only ozone is measured but also NO2, water, SO2 and formaldehyde (HCHO). The GOME instrument is aboard the satellite ERS-2 and takes spectra in the UV-VIS and near infrared range (240-790 nm).
|
|
 |
|
|
4. Satellelite based spectra of various inorganic compounds in the atmosphere, taken from the GOME instrument.
source: Satellite group IUP Heidelberg
Please click to enlarge! (150 K)
|
|
 |
|
|
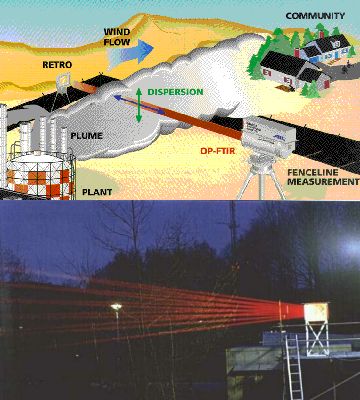
5. a+b) Please note: Infrared light is not visible. Here the beams can only be seen, because the light source emits also in the red part of the visible spectrum.
|
|
|
Certainly the light source and the detector can also be installed both on the ground. Since they cant be too far away from each other and since the concentrations are rather small, complicated mirror optics are used (e.g. a so called White-cell) in order to reflect the beam several times and to elongate the length of the way of the light through the atmosphere. The left hand side image shows such a set-up in theory (image from EPA Field Analytik Technology Enyclopaedia) and in practise (photo from FZ Jülich). Here infrared spectroscopy is used and a simple example for a spectrum given below.
|
 |
|
|
6. As a simple example the infrared spectrum of CO2 is given together with the activated vibrations. IR spectra can be rather complicated if absorptions of different molecules overlap or if the molecules are complicated themselves so that many vibrations are possible (see the example vibrations of CO2 on the right).
Spectrum and animations from: Scott Van Bramer, Widener University
|
|
|
Vibrations:
A Asymetric stretch
B Symmetric stretch
[not IR active]
C vertical bend
D horizontal bend
|
About this page:
author: Dr. Elmar Uherek - Max Planck Institute for Chemistry, Mainz
scientific reviewer: Dr. Mark Lawrence - Max Planck Institute for Chemistry, Mainz - 2004-05-05
educational proofreading: Michael Seesing - Univ. of Duisburg - 2003-07-02
revised and last published: 2004-05-10
|
|
|
|