|
|
 |
|
|
|
 |
| |
|
|
 |
Climate in cities
Basics |
Negative effects of air pollution
Air pollution has both local and global impacts. Harmful substances, emitted to the atmosphere, cross the countries' borders with the wind. Therefore, international co-operation is necessary to improve air quality.
|
|
|
|
|
 |
|
Global negative effects of air pollution include e.g. enhanced greenhouse effect or ozone hole. Smog and acid rains are best known local effects, and they concern people living mainly in urban areas. Air pollution is a threat for our health, and it can also cause economic losses.
|
 |
 |
|
1. Urban air pollution.
Individual heating systems contribute to the urban air pollution
Source: www.freefoto.com
|
|
 |
Let us pay more attention to the air pollution in cities. Due to emissions from different sources, the following substances can be found in the urban air: sulphur and nitrogen oxides, hydrocarbons (mainly from refineries and traffic), carbon oxide, heavy metals (from traffic and industry), dust and soot. However, the share of particular pollutants in the overall air pollution varies; e.g. in the developed countries sulphur does not play the main role any more. The concentration of the pollutants in the air (which is the result of pollution imission) decides on air quality. |
Smog
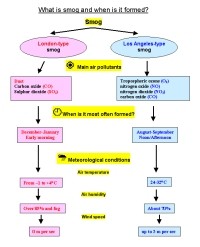
In many cities, the air pollution exceeds the allowed concentrations and the so-called smog alarms have to be announced. The word "smog" means a combination of smoke and fog. The word was invented around 1911 by a physician Harold Des Voeux. There are two kinds of smog: |
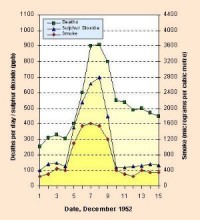
- London-type smog, caused mainly by air pollution due to combustion of coal and emission of sulphur dioxide (SO2) and dust. Such pollution mixed with fog can produce droplets of sulphuric acid (H2SO4) suspended in the air. When in 1952, in London, the concentration of SO2 during a smog event exceeded 3.5 mg per 1 m3 of the air (or 3500 µg per 1 m3), it caused massive cases of decease (Note: 1 mg is 0.001 g; another unit is 1µg which is equal to 0.000001 g. So 1 g = 1000 mg or 1000000 µg). London-type smog occurred first in 1850s, and today forms rather rarely. For example, in 2001, mean annual concentartion of SO2 reached 3 µg/m3 in Barcelona (Spain), 4 µg/m3 in Munich (Germany), 7 µg/m3 in London (Great Britain - data for 1999) and 13 µg/m3 in Warsaw (Poland). However, on some days, the concentration of SO2 may reach much higher values. The highest hourly values for 2001 were 211 µg/m3 in Warsaw, 106 µg/m3 in London (data for 1999), 70 µg/m3 in Barcelona and 17 µg/m3 in Munich.
|
 |
 |
 |
|
2. Number of deaths in London in December 1952 during the smog event and high concentration of sulphur dioxide.
Please click to see enlarge! (38 K)
Source: Manchester Metropolitan University
|
|
- Los Angeles-type smog (photochemical smog), which occurs on sunny days due to intense traffic. Oxides of nitrogen in exhaust gases and hydrocarbons (from various anthropogenic and biogenic sources) react in the presence of sunlight to produce a noxious mixture of aerosols and gases. Photochemical smog contains ozone (i.e. tropospheric ozone), formaldehyde, ketones and PAN (peroxyacetyl nitrates). Ozone can reach as high content (mixing ratio) as 12 ppm in the stratosphere while it usually does not exceed 0.04 ppm at the Earth's surface. All the mentioned substances irritate the eyes and damage the respiratory system. They also effect vegetation. That type of smog is rather common at present in large cities in summer. It has somehow replaced the London-type smog in many cities since the 1960s, in Western Europe since 1980s.
Read more about concentrations and mixing ratio in the part "Higher atmosphere" (Basics, Undestanding the stratosphere, Composition).
|
 |
 |
 |
|
3. What is smog and when is it formed?
Please click to see enlarge! (86 K)
Authors: Anita Bokwa, Michael Seesing
|
|
 |
 |
|
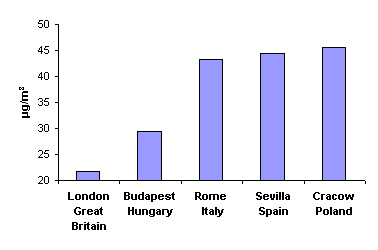
4. Mean annual concentration of particulate matter less than 10 µm in diameter in 1999
Source: APHEIS - Monitoring the Effects of Air Pollution on Health in Europe
|
|
 |
Dust and soot
Another arduousness in the cities is the dust and soot. In 1999, for example, the mean annual concentration of particulate matter less than 10 micrometers of diameter (PM10) amounted 21.8 µg/m3 in London, 29.5 in Budapest, 43.3 in Rome, 44.4 in Sevilla and 45.4 in Cracow. For comparison: in Cracow, in the 1970s and 1980s, the mean annual concentration exceeded 100 µg/m3, and in winter even 200 µg/m3, due to emissions from the steel work and power plant; those factories have been modernised since then and the production decreased, so the air quality improved significantly.
|
Limit values
For every pollutant, there are established limit values of concentration which should not be exceeded. Otherwise, the air pollution may be harmful and dangerous for our health or even life. For the European Union countries, the limit values and alert thresholds for ambient air were established with the Council Directive 96/62/EC of 27 September, 1996. Detailed regulations were included in three Council Directives: 1. 1999/30/EC of 22 April, 1999; 2. 2000/69/EC of 16 November, 2000, and 3. 2002/3/EC of 12 February, 2002.
|
 |
 |
 |
|
5. European flag, a symbol of united Europe.
As air pollution is an international problem, the legal regulations about emissions are established by the Council of the European Union for all the member countries.
Source: www.freefoto.com
|
|
 |
 |
|
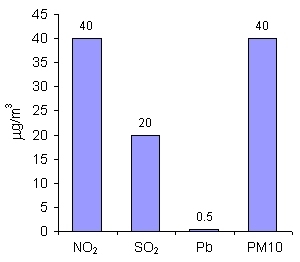
6. Limit values for NO2, SO2, Pb and PM10 (mean annual concentrations) in the countries of the European Union
Author: Pawel Jezioro
|
|
 |
For nitrogen dioxide (NO2), sulphur dioxide (SO2), lead (Pb) and particulate matter of the diameter up to 10 µm (PM10), the limit values are given as mean annual concentration. It means that on particular days, the concentration may be higher than the limit value, while on other days it may be much lower, but the mean annual value is taken under consideration. The limit values for SO2 and Pb are much lower than for NO2 and PM10, as those substances are very harmful for human health even in small amounts. |
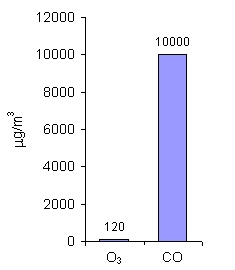
For ozone (O3) and carbon monoxide (CO), the limit values are given as mean 8-hour concentration. Those gases are very toxic for people even in small amounts and short periods of exposure (i.e. time during which people breath such polluted air). As you can see, the allowed amounts of ozone are much lower than for CO. Ozone in the air near the ground, formed usually during the photochemical smog, is harmful for us, while ozone in the stratosphere protects life on the Earth.
|
 |
 |
 |
|
7. Limit values for O3 and CO (mean 8-hour concentrations) in the countries of the European Union.
Typical background value for CO is 50-200 ppb.
Author: Pawel Jezioro
|
|
 |
 |
|
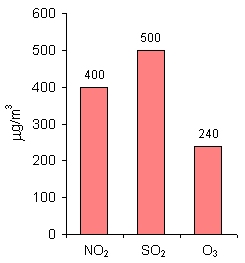
8. Alarm values for NO2, SO2 and O3 (mean 1-hour concentrations) in the countries of the European Union
Author: Pawel Jezioro
|
|
 |
Alarm values
For NO2, SO2 and O3, apart from limit values, there are also alarm values established. Those are mean 1-hour concentrations. If those values are exceeded, the local authorities should first inform the public about it and then undertake actions that would decrease the pollutants' concentration in the air, e.g. limit the traffic in a city, decrease for some time industrial production etc. |
|
About this page:
Authors: Pawel Jezioro, Anita Bokwa - Jagiellonian University - Cracow / Poland
Supporter: Grzegorz Wawrejko
1. Scientific reviewer: Prof. Barbara Obrebska-Starkel - Jagiellonian University - Cracow / Poland - 2003-06-20
2. Scientific reviewer: Dr. Marek Nowosad - Maria Curie-Sklodowska University - Lublin / Poland - 2003-06-16
educational reviewing: Michael Seesing - University of Duisburg - Duisburg / Germany
last update: 2004-12-17
|
|
 |
|


