|
|
 |
|
|
|
 |
| |
|
|
 |
Lower Atmosphere
Basics |
Vegetation fires
Fires are a natural phenomenon on our planet. As a result of dry periods and lightning there have always been natural fire which serve as a regeneration of the vegetation. However, nowadays, most fires are caused by humans, especially in the tropical regions.
Human made fires can be in consequence of carelessness or even malicious arson. But in many cases the reason is organised landuse change. In particular in the tropics large areas of rain forest are burnt in order to use them for agriculture.
|
|
|
|
|
 |
 |
 |
|
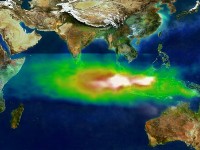
1. Smog plume from vegetation fire at Indonesia
Image courtesy NASA GSFC Scientific Visualization Studio, based on data from TOMS
Please click to enlarge (50 K)!
http://svs.gsfc.nasa.gov
|
|
 |
Huge fires destroyed vast areas in the Indonesian rain forest in 1997:
The image (left) shows the pollution as detected by the TOMS satellite over Indonesia and the Indian Ocean on October 22, 1997. White represents the aerosols (smoke) that were directly emitted from biomass burning, and remained in the vicinity of the fires. Green, yellow, and red pixels represent increasing amounts of tropospheric ozone (smog) being carried to the west by high-altitude winds. Ozone is not directly formed in the fire. It is produced in the atmosphere when oxidation of organic compounds takes place in the presence of high concentrations of nitrogen oxides (NO and NO2). The nitrogen oxides are formed in the hot fire flames.
As we see, fires do not only change the landscape. They also change the chemical composition of the air.
|
What is emitted by the fires?
Emissions from biomass burning consist of gaseous compounds:
carbon dioxide CO2,
carbon monoxide CO,
nitrogen oxides NOx (= NO + NO2),
methane (CH4), as well as larger hydrocarbons,
and particulate compounds, mainly organic and black carbon
Biomass burning is an important contributor to the global atmospheric budgets of CO and NOx . Also much CO2 is emitted, if old forests containing a lot of biomass are burnt. On the other hand natural savannah fires need not to be a source of CO2, since the black carbon is partially stored as sediment on the ground and the fresh grass in the burned area takes up CO2 while growing in the next season. So there is a sort of equilibrium and we would not have the problems if humans would not intervene.
|
 |
|
 |
 |
|
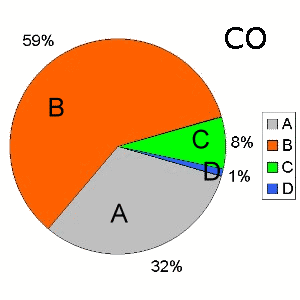
3. sources of CO
chart: Elmar Uherek
|
|
 |
Example: Carbon monoxide CO
The circular chart gives an overview of global sources for atmospheric carbon monoxide [Tg = million tons]. Biomass burning dominates.
A: Technological = 400 Tg CO / year
B: Biomass burning = 748 Tg CO / year
C*: Terrestrial biosphere = 100 Tg CO / year
D: Oceans = 13 Tg CO /year
*primarily soils (degradation of plant material), IPCC 1996 estimates for CO from oceans+soils 80-360 Tg CO / year.
About 20% of the global nitrogen oxide emissions are due to vegetation fires. Since NOx contributes to the ozone formation, high ozone concentration can be found in the plumes of the fires.
|
|
Landuse change
If forests which have been there for hundreds of years, are transformed into farmland or little towns or streets, then humans destroy the original vegetation and cause an irreversible transformation of organic material into CO2. This is what we call landuse change. The situation in the rain forests for example in Africa or in Brazil is well studied ... let's have a view on a field campaign in Rondônia / Brazil.
|
 |
 |
|
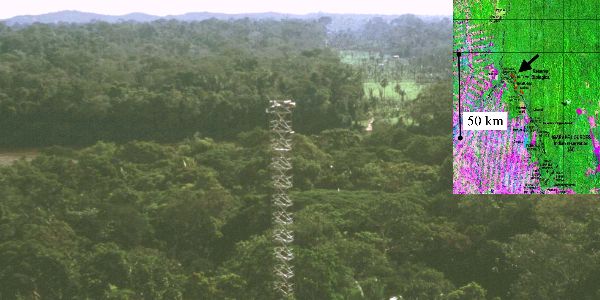
4. Measurement site in the province Rondônia / Brazil - satellite picture from LANDSAT
photo: Greg Roberts
|
|
|
 |
The satellite picture shows the location of the measurement site (arrow) in the south-central Amazon Basin and the massive deforestation in this region. Deforestation started in this region some 25 years ago, after the Cuiabá-Porto Velho highway was constructed in 1968, from which settlers started clearing the forest, creating the typical “fishbone” pattern visible from satellite.
5. left photograph: Jacques Descloitres, MODIS Land Rapid Response Team / NASA visible Earth
Please click to enlarge! (70 K)
|
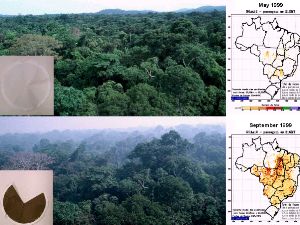
The burning season occurs during the dry season in June-November. The pictures on the right compare the situation in May 1999 (top picture, wet season) and in September 1999 (bottom, dry season). The difference becomes obvious if you have a look on the fire pixel map of Brazil on the right. Red and yellow colours stand for fires. Researchers have collected aerosols on a filter during both seasons. While filters in the wet season are usually clean after sampling (top left), they are completely black from soot and organic material in the fire season (bottom left).
90% of the CO2 emissions from landuse change are due to such forest fires.
Photos have been made by Greg Roberts during field campaigns from the measurement tower shown above (location: S 10° 04', W 61° 58').
|
 |
 |
 |
|
6. Measurement in the rainforest in the wet and in the dry burning season
photos: Greg Roberts / Pascal Guyon
Please click to enlarge! (70KB)
|
|
About this page:
author: Elmar Uherek - Max Planck Institute for Chemistry, Mainz
1. scientific reviewing: Dr. Jörg Trentmann, University of Washington, Seattle - 2003-02-21
2. scientific reviewing: Dr. Pascal Guyon, Max Planck Institute for Chemistry, Mainz - 2003-05-10
educational proofreading: Michael Seesing - Uni Duisburg - 2003-07-02
revised and last published: 2004-05-16
|
|
 |
|


