|
|
 |
|
With the following experiments you can find out which gases can serve as greenhouse gases.
You need the following materials and chemicals:
|
1 |
dry round-bottomed 1L-flask made of clear glass |
|
1 |
thermometer with 0,1° units |
|
1 |
stopper drilled through, matching the thermometer and the flask |
|
1 |
infrared light |
|
1 |
stop watch |
| |
retort stands, clamps, sockets |
| |
carbon dioxide |
| |
methane (natural gas) [F+; R: 12; S: 2-9-16-33] |
| |
water |
| |
air (compressed air or bicycle tire-inflator with normal air) |
|
optional |
other gases (e.g. nitrogen, oxygen, etc.) |
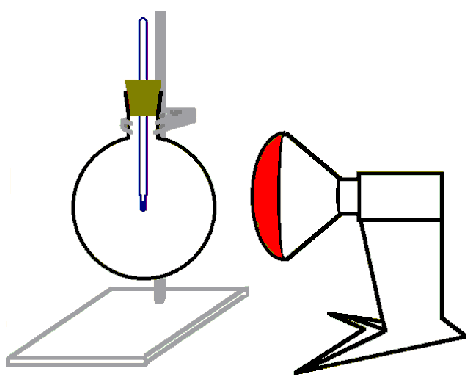
Set up the experiment according to Figure 1:
|
 |
 |
|
Figure 1
Experimental set-up (distance lamp --- flask: approx. 20 cm but constant)
© 2004 Seesing, Tausch Universität-Duisburg-Essen, Duisburg
|
Stick the thermometer into the stopper. Fill the flask with carbon dioxide. Close the flask with the stopper and make sure that the thermometer tip is in the middle of the flask. Illuminate the flask with the infrared-lamp for 5 minutes. Take the temperature in 30-seconds intervals.
Repeat the experiment with
a) air, b) methane [Be careful! Methane is easily flammable and its density is less than that of air.], c) air that is saturated with water (add some water to the air inside the flask and shake it vigorously shortly before the experiment), d) optionally with other gases
Note your measured values in the table below:
| |
temperature |
|
time [sec] |
carbon dioxide |
air (dry) |
methane |
air (humid) |
. |
. |
|
0 |
. |
. |
. |
. |
. |
. |
|
30 |
. |
. |
. |
. |
. |
. |
|
60 |
. |
. |
. |
. |
. |
. |
|
90 |
. |
. |
. |
. |
. |
. |
|
120 |
. |
. |
. |
. |
. |
. |
|
150 |
. |
. |
. |
. |
. |
. |
|
180 |
. |
. |
. |
. |
. |
. |
|
210 |
. |
. |
. |
. |
. |
. |
|
240 |
. |
. |
. |
. |
. |
.. |
|
270 |
. |
. |
. |
. |
. |
. |
|
300 |
. |
. |
. |
. |
. |
. |
|
Present all measured values in the following temperature-time-diagram. Before you do that you have to find a reasonable scale for the temperature and add it to the diagram.
|
Arrange the tested gases according to their ability to absorb heat radiation. Start with the gas that absorbs heat best.
Write the following symbols into the boxes: >> much better than; > better than; ≥ only a little better than
Give reasons for the order in which you arranged the results of your experiment. |
|
Which of the gases you tested seems to be the strongest greenhouse gas? Give reasons for your choice. |
|
About this page:
Authors: M. Seesing, M. Tausch - Universität Duisburg-Essen, Duisburg / Germany
Scientific Reviewing: Dr. Pascal Guyon, Max Planck Insitute for Chemistry, Mainz - 2004-05-10
Last update: 2004-05-13 |
|
 |
|


