|
|
 |
|
|
|
|
| |
|
|
|
Lower Atmosphere
Read more |
The Greenhouse gases
carbon dioxide and methane
Although water vapour is the most important greenhouse gas, usually carbon dioxide (CO2) and methane (CH4) make headlines. The concentration of these gases is by far lower than water vapour, but they partially close the small atmospheric window, where heat radiation can leave the atmosphere and their concentration is continuously increasing ....
|
|
|
|
|
|
|
|
|
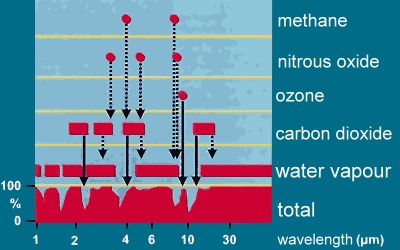
The image shows why greenhouse gases are rather efficient as greenhouse gases. Water vapour absorbs at a wide range of wavelengths the infrared radiation emitted by the Earth surface and keep back the heat. At some wavelengths however, the absorption is weak or close to zero and the water vapour barrier has an permeable window. Exactly at this wavelengths other greenhouse gases as CO2 or CH4, but also nitrous oxide, ozone and chlorofluorocarbons absorb and shorten the window.
|
|
The effect is much stronger than a comparable increase in the concentration of water vapour could be. These greenhouse gases are more efficient. Therefore the impact depends on the one hand on the concentration of the gas, on the other hand on their efficiency.
The concept of a Global Warming Potential (GWP) has been developed to compare the ability of each greenhouse gas to trap heat in the atmosphere relative to another gas. Carbon dioxide (CO2) was chosen as the reference.
|
|
Greenhouse gases, their concentration in 1750 (preindustrial) and 1998 and the 100 years horizon global warming potential (GWP). Data from IPCC TAR 2001:
|
Greenhouse gas |
abundance 1750 |
abundance 1998 |
100 year GWP |
|
carbon dioxide CO2 |
280 ppm |
365 ppm |
1 |
|
methane CH4 |
700 ppb |
1745 ppb |
23 |
|
nitrous oxide N2O |
270 ppb |
314 ppb |
296 |
|
troposph. ozone* O3 |
25 DU
(10 ppb) |
34 DU
(30-40 ppb) |
|
|
CFC-11 CFCl3 |
0 |
268 ppt |
4600 |
|
CFC-12 CF2Cl2 |
0 |
533 ppt |
10600 |
1 DU = Dobson Unit = 0.01 mm pure ozone column
*since ozone is not evenly spread in the atmosphere, only rough assumption of average ppb mixing ratios for the lower troposphere can be given
| |
Development of CO2 emissions
From the analysis of ice core data we know, that during the last 400,000 years the concentration of CO2 in the air always ranged between 180 ppm during glacial times and 280 ppm during interglacials. This trend changed with the beginning industrialisation and man's increasing exploitation of fossil fuel (coal, oil, gas) as energy source. CO2 emissions exponentially increased and reached a value of about 370 ppm at present. Compared the rather stable situation of several thousand years in the current warm period, the CO2 increase of the last 200 years has been fast and primarily caused by human impact. Which emissions contributed to this increase?
|
|
 |
|
|
2. CO2 trend of the last 400,000 years from analysis of the Vostok ice core
source: IPCC TAR 2001 fig 3-2
|
|
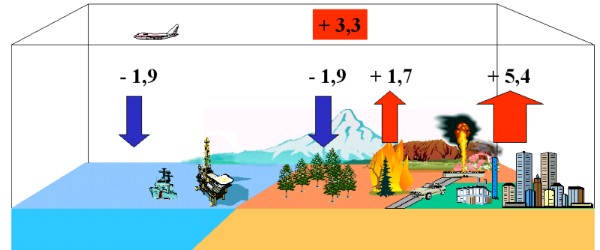
Every year several billion tons of anthropogenic carbon (1 Petagramm C = PgC = 1x10¹⁵ g = bio tons) are emitted to the atmosphere as CO2, 5.4 ± 0.3 PgC/yr in the 80ties, 6.3 ± 0,4 PgC/yr in the 90ties nearly exclusively from fossil fuel burning. Another 1.5 - 2 PgC/yr may come from landuse change, first of all from vegetation fires. More unsecure are the sinks. From the concentration in the air it is known, that only about 3.2 to 3.3 ± 0.1 PgC/yr remained in the atmosphere. Uptake to the oceans may make up for 1-2 PgC / yr. Here, CO2 ends as carbonate.
|
|
 |
|
|
3. CO2 trend of the last decades. The increase of CO2 goes in parallel with a slight decrease in atmospheric oxygen, which is lost during the oxidation processes.
source: IPCC TAR fig 3-2
|
|
|
It is assumed that also a lot has been taken up by a growing vegetation (ca. 2 PgC/yr). This means additional biomass formation beyond the former equilibrium. Especially CO2 fixation by plants can easily vary by a factor of 2 from year to year related to different weather conditions e.g. caused by El Niño.
|
 |
|
|
4. The CO2 budget: Estimated average sources and sinks for the 1980ies in PgC per year. Fossil fuel burning and landuse change act as sources, the vegetation and the ocean as sinks.
image by Elmar Uherek, data from IPCC TAR 2001
|
|
|
|
|
The carbon cycle
Exchange of CO2 between the biosphere and the atmosphere occurs in a much bigger dimension than the amounts shown above. It is assumed, that every year about 270 PgC dissolve in leave water or are temporarily stored during (so called autotrophic) respiration. About 60 PgC contribute to the annual plant growth, called net primary production NPP. But since the natural carbon cycle is an equilibrium, all of NPP goes back to the atmosphere by heterotrophic respiration of decomposers and by biomass burning. The CO2 concentration in the atmosphere does not significantly change. This equilibrium has been disturbed by additional contribution due to human activities as described above.
|
|
Methane's globally averaged surface abundance in 1998 was 1745 ppb. The uncertainty of the total burden and divergences in the tropospheric distribution are small. However, since emissions from wetlands show high variations and e.g. emissions from rice field have probably been overestimated (perhaps only 40 Tg / yr) the exact sources are uncertain. The table gives an overview from two authors.
|
|
Sources of methane (global emissions per year):
|
Source (selected) |
emissions [Tg CH4 / yr]
(Hein et al., 1997) |
emissions [Tg CH4 / yr]
(Lelieveld et al., 1998) |
|
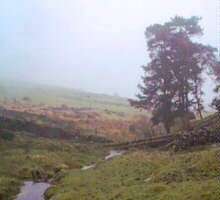
wetlands + rice |
325
(237 + 88) |
225 |
|
energy sector |
97 |
110 |
|
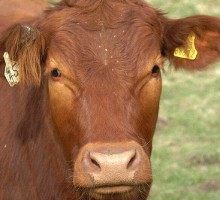
ruminants |
90
(incl. waste treatment) |
115 |
|
landfills |
35 |
40 |
|
biomass burning |
40 |
40 |
|
others |
- |
(70) |
|
Total |
587 |
600 | |
|
 |
|
|
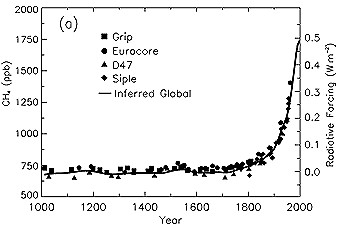
6. Change in CH4 abundance (mole fraction, in ppb = 10-9) determined from ice cores, firn, and whole air samples plotted for the last 1,000 years. Radiative forcing, approximated by a linear scale since the pre-industrial era, is plotted on the right axis.
Source: IPCC TAR Fig. 4-1
|
|
|
About 60% of methane emissions are due to human activities as agriculture, fossil fuel use and waste disposal. Due to the growing human contribution the methane concentration has been more than doubled during the last 1000 years.
The most important sink of methane is the reaction with OH:
 OH + CH4 -> CH3 + H2O OH + CH4 -> CH3 + H2O
But the reaction is rather slow and the atmospheric lifetime of methane 8.4 years. |
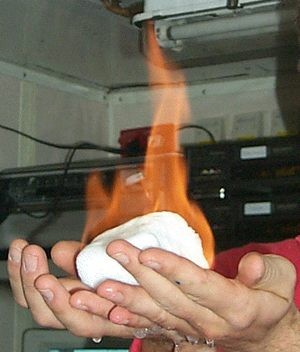
Methane hydrates
Enormous amounts of CH4 (a still unused giant energy resource) are stored in methane hydrates, solid methane ice mixtures, which is stable at high pressures and low temperatures, e.g. at the ground of the oceans or in deeper layers of permafrost soil. The estimations of resources are in the range of 10,000 PgC, which is roughly twice the amount of ordinary fossil fuel (oil, gas, coal) available on Earth. During the last 400,000 years (Vostok ice-core data) there were no indications for large releases from this resources. However it is not sure, if the increasing surface temperature could not cause a beginning decomposition of the methane hydrates during the next centuries and this way contribute additionally to the greenhouse effect.
|
|
|
About this page:
author: Dr. Elmar Uherek - Max Planck Institute for Chemistry, Mainz
scientific reviewing: Dr. Benedikt Steil - Max Planck Institute for Chemistry, Mainz
educational proofreading: Michael Seesing - Uni Duisburg - 2003-07-02, Yvonne Schleicher - Uni Erlangen
last published: 2004-06-17
|
|
|
|