|
|
 |
|
|
|
|
| |
|
|
|
Climate in cities
Basics |
Areas endangered by acid rains
Acid rains occur mainly in the highly industrialized regions where the emissions of SO2 and NOx are large. However, due to transportation by winds, they may affect areas located thousands kilometres away from the emittors.
|
|
|
|
|
|
Long-range transport
In the 18th century, acid rain fell mainly only in towns and cities. Since the 1950s, the use of high chimneys and stacks to disperse air pollution has improved air quality in urban areas. Unfortunately, the air pollution is blown far away from its source, high into the atmosphere, sometimes to other countries downwind, also to areas where there are no power plants, cars and no industry at all, where it falls as acid rain. For example, in Sweden and Norway, around 90% of the acid deposition comes from other countries, primarily the United Kingdom, Germany and Poland, and international shipping.
|
|
 |
|
|
1. The distribution of 600 largest emitters of SO2 in Europe. At the top of the list are two large coal-fired power stations in Bulgaria. Together they let out nearly 600,000 tons of sulphur dioxide a year - as much as the combined total from all the following countries: Austria, Belgium, Denmark, Finland, the Netherlands, Norway and Sweden.
Click on the image to see it enlarged (114 KB)!
Source: Barrett M., 2000, The worst and the best. Atmospheric Emissions from Large Point Sources in Europe, SENCO, UK, Swedish NGO Secretariat on Acid Rain.
http://www.acidrain.org/APC15.pdf
|
|
|
Endangered regions
The areas most endangered by acid rains are those where the acid rocks can be found on the surface, where precipitation is rather high, and where there are many sources of SO2 and NOx emissions. The increasing demand for electricity and the rise in the number of motor vehicles in recent decades has meant that emissions of acidifying pollutants have increased dramatically from human sources, particularly since the 1950s (read also about natural emissions of SO2 and NOx).
|
 |
|
|
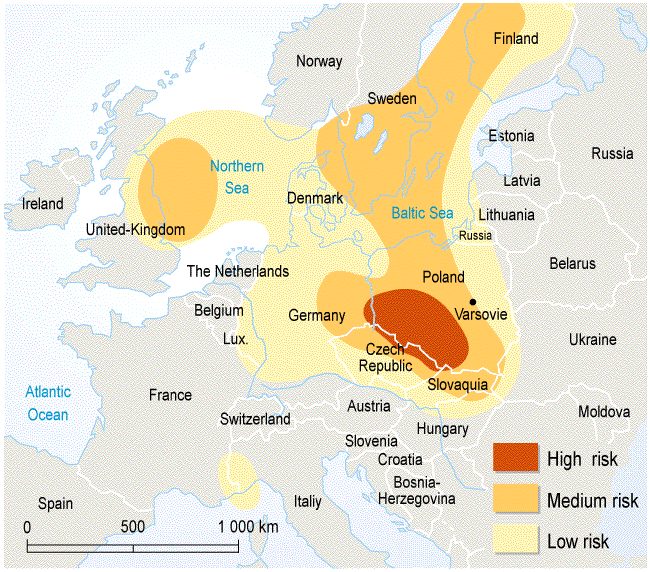
2. The risk of acid rain in Europe in 1993.
Click on the image to see it enlarged (112 KB)!
Source: UNEP GRID-Arendal, based on European Atlas of Environment and Health (http://www.grida.no/db/maps/prod/level3/id_1177.htm)
|
|
|
Europe
Most endangered is northern and central Europe. The pollutants' emissions are heavily concentrated in the industrial areas. As a result, precipitation is generally acidic in these regions (pH 4.1 to pH 5.1). The comparison of Figures 1 and 2 shows that Scandinavian countries are endangered by acid rains even though there are no large emission sources of SO2 there. |
In Scandinavia, the acidity and pollutant content of precipitation are greatest in the southern parts of Sweden. Deposition of acidifying substances is determined, however, not only by the acidity of precipitation but also by precipitation quantities. Consequently the heaviest acid deposition in Sweden affects the precipitation-rich parts of south-west Sweden.
|
|
 |
|
|
3. Total deposition (i.e. wet and dry) of sulphur (left map) and nitrogen (right map) in Sweden, in 1996. Units: mg per m2 per year.
Source: Swedish Environmental Protection Agency
http://www.internat.naturvardsverket.se/
|
|
North America
Most endangered are highly urbanised and industrialised regions of eastern Canada and north-eastern USA. Sources of SO2 in the USA are concentrated in Ohio, Indiana and Illinois, and prevailing winds carry it to New England and Canada. Figures 4 and 5 show areas with the highest deposition of acidifying substances. The areas that combine acid rain and little neutralising capacity are located at high elevations east of the Mississippi.
|
|
 |
|
|
4. Deposition (in kg/ha) of SO4 in the USA, in 2002.
Click on the image to see it enlarged (52 KB)!
Source: National Atmospheric Deposition Program (NRSP-3)/National Trends Network. (2004). NADP Program Office, Illinois State Water Survey, 2204 Griffith Dr., Champaign, IL 61820.
http://nadp.sws.uiuc.edu/isopleths/annualmaps.asp
|
|
 |
|
|
5. Deposition (in kg/ha) of NO3 in the USA, in 2002.
Click on the image to see it enlarged (53 KB)!
Source: National Atmospheric Deposition Program (NRSP-3)/National Trends Network. (2004). NADP Program Office, Illinois State Water Survey, 2204 Griffith Dr., Champaign, IL 61820.
http://nadp.sws.uiuc.edu/isopleths/annualmaps.asp
|
|
|
Major problems to aquatic life from acidic rain include e.g. loss of Atlantic salmon in Nova Scotia and Maine and reduction in fish diversity in northwest Pennsylvania. 41% of lakes in the Adirondack region of New York are either chronically or episodically acidic. In Canada, acid rain has resulted in large losses of fish and aquatic communities in over 30,000 sensitive lakes in Ontario and Quebec. |
|
Asia
Acid rain is now emerging as a major problem in the developing world, especially in parts of Asia and the Pacific region where energy use has surged and the use of sulfur-containing coal and oil is very high. China and India have become endangered in the mid-1970s, when the industry development was most intensive there. An estimated 34 million metric tons of SO2 were emitted in the Asia region in 1990, over 40% than in North America. Acid deposition levels were particularly high in areas such as southeast China, northeast India, Thailand, and the Republic of Korea, which are near or downwind from major urban and industrial centers. The effects are already being felt in the agriculture sector. Researchers in India found that wheat growing near a power plant where SO2 deposition was almost five times greater than the critical load (about critical load see the section below) suffered a 49% reduction in yield compared with wheat growing 22 kilometers away. In southwestern China, a study in Guizhou and Sichuan provinces revealed that acid rain fell on some two thirds of the agricultural lands, with 16 percent of the crop area sustaining some level of damage. A study of pines and oaks in acid rain-affected areas of the Republic of Korea, both rural and urban, showed significant declines in growth rates since 1970.
Negative effects of acid rains have been also observed in Brazil and Venezuela.
|
|
Critical loads and target loads
|
 |
|
|
6. Sequence of eight maps showing the temporal development (1960 - 2010) of the exceedance of the 5th percentile maximum critical loads of sulfur ("acidity critical load"). White areas indicate non-exceedance or lack of data. Red colour marks the areas where the deposition of sulphur was much larger than the amount allowed and acceptable for the environment; in those areas the acidifying effect of sulphur was the greatest. For detailed explanations go to the source web page mentioned below.
Click to see enlarged image (120 KB)!
Source: Coordination Center for Effects (CCE) at RIVM
http://arch.rivm.nl/cce/
and click there: "data" on the left bar, and then "critical loads databases and maps". For the explanation on the 5th percentile click on "Methods and models" on the left bar.
|
|
|
Critical loads are the maximum amount of pollutants that ecosystems can tolerate without being damaged, the amount that will not cause chemical changes leading to long-term harmful effects in the most sensitive ecological systems. In order to obtain values for the critical loads, an ecosystem has to be chosen and then a suitable indicator species is selected to represent the ecosystem. A chemical limit is subsequently defined as the concentration at which the indicator species will die. In forests the indicators are trees, and in freshwaters they are fish.
In order for critical loads to be used, target loads need to be set for different areas in order to try and halt the acidification processes. Target loads have been defined as "the permitted pollutant load determined by political agreement". Therefore, target loads can be either higher or lower than the critical load values. |
|
In 1990, around 93 million hectares of natural environment in Europe were affected by acid deposition that exceeded the critical load. In order to achieve the desired limits it will be necessary to reduce acidifying pollution in parts of Europe by 80-90% compared with 1990 levels.
|
About this page:
author: Anita Bokwa - Jagiellonian University, Cracow, Poland
supporter: Anna Gorol
educational reviewing: Michael Seesing - University of Duisburg, Duisburg, Germany
last update: 2004-08-05
|
|
|
|