|
|
 |
|
|
|
|
| |
|
|
|
Climate in cities
Basics |
What is acid rain?
Water is essential for life on the Earth. Therefore, when it is polluted, the whole environment is affected. Acid rain is primarily caused by anthropogenic emission of air pollution, due to the combustion of fossil fuels. The acidity of the rain can be measured with the pH scale. |
|
|
|
|
|
|
Atmospheric precipitation (rain, drizzle, snow etc.) goes to rivers, infiltrates down into the soil, or evaporates and becomes water vapor. An important parameter describing the water quality is the pH index.
|
 |
|
|
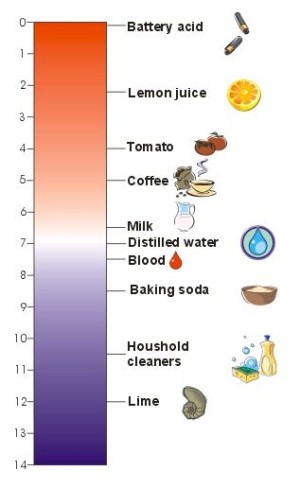
1. The pH scale. Typical pH of some nourishments and concentrated aqueous solutions of means we use in our housholds. The lower the number, the higher the acidity.
Author: Sebastian Wypych
|
|
|
The pH scale
In nature, we find many chemical compounds which are dissolved in water, making aqueous solutions which have a certain pH. The more acidic the solution, the lower pH.
pH is the negative logarithm of the hydronium ion concentration in moles per liter (mol/l).
pH = -log10[H3O+]
If the hydronium ion concentration c(H3O+) = 10-7mol/l, the pH is 7, if it is 10-6 mol/l, the pH is 6 etc.
This scale was invented by a Danish scientist Soren Sorenson in 1909. The pH scale ranges from 0 to 14, with a value of 7 considered neutral. Values greater than 7 are alkaline and below 7 are acidic. For example, vinegar has pH 2.5-3, distilled water 7.0, concentrated aquous solution of baking soda (NaHCO3(aq)) 8.2, some houshold cleaners containing ammonium hydroxide (NH4OH(aq)) 11-12, and slaked lime (Ca(OH)2(aq)) 12.4.
In pure water, the only source of H3O+ is the following reaction:
2 H2O  H3O+ + OH- H3O+ + OH-
liquid hydronium hydroxide
water ion ion
Arrows in both directions indicate that the reaction is reversible. Acids are substances that, when added to a solution, dissociate, increasing the molarity of H+. The more H+ added, the stronger the acid and the lower the pH. |
|
Acid rain
Precipitation is usually somewhat acidic, as the carbon dioxide (CO2) occurring naturally in the air dissolves in it, creates a solution of carbonic acid (H2CO3) and causes pH around 5.6. This is because carbonic acid is not stable but dissociates in water forming hydronium ions and hydrogen carbonate:
|
 |
|
|
In a more alkaline solution of higher pH the hydrogen carbonate can lose another hydrogen ion and become carbonate. Many rocks and sediments, e.g. dolomite or limestone, consist of carbonate salts.
|
 |
|
|
|
|
But clean rain is slightly acidic because of the dissociated carbonic acid. We talk about acid rain when the pH of precipitation is below 5.6. However, some scientists consider precipitation with pH < 5.0 as acid rain. Apart from acid rain, there may be also acid snowfall or acid fog, so we can generally talk about acid precipitation. The human contribution to acid rain comes from nitrogen and sulfur compounds.
SO2 and NOx go through several complex steps of chemical reactions before they become the sulfuric acid (H2SO4) or nitric acid (HNO3) found in acid rain.
|
|
Sulfuric acid comes from sulfur compouds:
sulfur dioxide and oxygen react to sulfur trioxide:
2SO2 +O2 -> 2SO3
sulfur trioxide and water react to sulfuric acid:
SO3 + H2O -> H2SO4
Nitric acid comes from nitrogen oxides:
nitrogen dioxide and water react to nitric acid and nitrous acid:
2NO2 + H2O -> HNO3 + HNO2 |
|
The pH of an acid cloud may be as low as 2.6. The acid rain pH in highly industrialized regions is usually around 4.0; fogs in Los Angeles often have a pH less than 3.0. However, in some areas of the world, such as northern Australia, organic emissions from natural vegetation create pH levels of around 4.4.
|
Cause: Emissions of SO2 and NOx
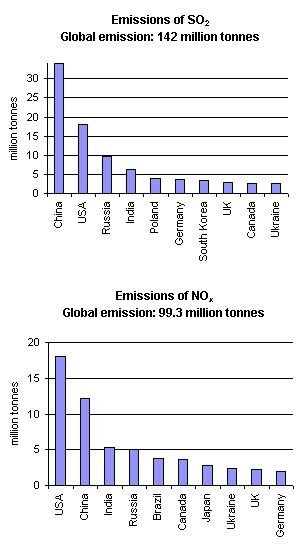
What makes the rain acid? Atmospheric acids are produced in the air mainly as a result of chemical reactions of the acid precusor gases (SO2 and NOx) and water. Most of SO2 and NOx is emitted to the atmosphere under the combustion of fossil fuel. Road transport, shipping and aircraft are significant sources of NOx emissions; natural sources include volcanoes, lightning strikes and biological decay. Natural sources of SO2 are volcanoes, oceans (demethyl sulfide and COS), biological decay and forest fires. Acid rain, however, is mainly an effect of human caused emissions. Figure 2 presents the countries which are the 10 largest SO2 and NO2 emittors. In both cases, USA, China, Russia and India emit the largest quantities, mainly due to large numbers of inhabitants, however e.g. in the USA, the emissions per capita are also very high, due to the abundant usage of energy.
|
|
 |
|
|
2. Emissions of SO2 and NOx in 1995. Since the data have been generated, SO2 in Europe and North America decreased, while in Asia it increased.
Author: Anita Bokwa
Source of data: World Resources Institute, Washington DC
http://earthtrends.wri.org
|
|
Uncertainties in global emissions
Considerable uncertainties are involved in compiling global emission inventories for SO2 and NOx. The natural emission of SO2 is estimated to make from 25 up to 50% of total global emissions. However, in industrialized and urbanized regions, the anthropogenic sources are belived to deliver as much as 90% of SO2 and NOx. The uncertainties vary strongly from one region to another. They are associated with scarcity of data, particularly on agricultural management, and flux measurements for diffuse sources such as soils and aquatic systems. Figure 3 presents the results of various studies. Please notice that in figure 3 and 4, the values refer to pure sulfur, while in figure 2 to sulfur dioxide.
|
|
 |
|
|
3. Development of the global anthropogenic sulfur emissions. Several studies are compared and presented together in one diagram.
Source: S. J. Smith, R. Andres, E. Conception, J. Lurz, 2004, Sulfur dioxide emissions: 1850-2000 (JGCRI Report. PNNL-14537)
Please click the image to see it enlarged (26 K)!
|
|
|
Changes in emissions
Humans have doubled the natural rate of nitrogen (N) fixation, and atmospheric N deposition rates have increased between three to more then 10 times, compared to pre-industrial times. Also, emissions of sulfur (S) into the atmosphere have more than doubled.
|
 |
|
|
4. Contribution of the major economic regions in the world to the anthropogenic sulfur emissions since 1850.
Source: S. J. Smith, R. Andres, E. Conception, J. Lurz, 2004, Sulfur dioxide emissions: 1850-2000 (JGCRI Report. PNNL-14537)
Explanations: Austurasia - Australia, New Zealand, South-Eastern Asia, Ocean Bunkers - fossil fuels used for ocean shipping
Click the image to see it enlarged (66 K)!
|
|
|
Since the industrial revolution, Europe and North America dominated the human contribution to global sulfur emissions. However, the growing emissions in East and Central Asia were mainly responsible for the global increase in emissions in the 1970s. Sulphur dioxide emissions in Europe already showed a notable increase at the end of the 19th century, due to industrialisation and rising coal consumption. After 1945 oil consumption grew very rapidly; sulphur emissions doubled between the end of the war and the beginning of the 1970s. |
|
Today, the dimensions of the acid rain problem are growing rapidly in Asia, with SO2 emissions expected to as much as triple from 1990 levels by 2010 if current trends continue. Curtailing the already substantial acid rain damage in Asia and avoiding much heavier damages in the future will require investments in pollution control on the order of those made in Europe and North America over the past 20 years. For example, sulphur dioxide emissions in Europe have been reduced by 44% in the period 1990 to 1998. Emissions of nitrogen oxides fell by 21 per cent over the same period. The USA and Canada experienced a 28% decline in SO2 emissions between 1980 and 1995.
|
|
The emissions are concentrated in a few regions of the world. East Asia dominates in SO2 emissions, while the USA delivers the largest amounts of NOx.
|
About this page:
authors: Anita Bokwa - Jagiellonian University, Cracow, Poland and Dr. Elmar Uherek - Max Planck Institute for Chemistry, Mainz, Germany
educational reviewing: Michael Seesing - University of Duisburg, Duisburg, Germany
last update: 2004-12-17
|
|
|
|